Home Vision & Mission Solutions Knowledge Base Contact Us
Infrastructure Performance Monitoring

Itheon Performance Monitor

Real-Time Performance Monitoring & Analytics

Itheon Performance Monitor is an advanced monitoring solution designed to provide real-time visibility into the performance, availability, and operational health of enterprise IT environments. The solution enables organizations to continuously monitor critical systems, network infrastructure, applications, and services to ensure optimal performance and business continuity.

By delivering comprehensive performance analytics and intelligent monitoring capabilities, Itheon Performance Monitor helps organizations proactively identify performance bottlenecks, detect service degradation, and resolve issues before they impact business operations or end-user experience.

Real-time monitoring
Continuous monitoring
Performance analytics
Intelligent alerting
Centralized dashboard
Historical reporting
Threshold monitoring
Enterprise-wide platform
Request Demo Download Brochure Demo running v6.5.0
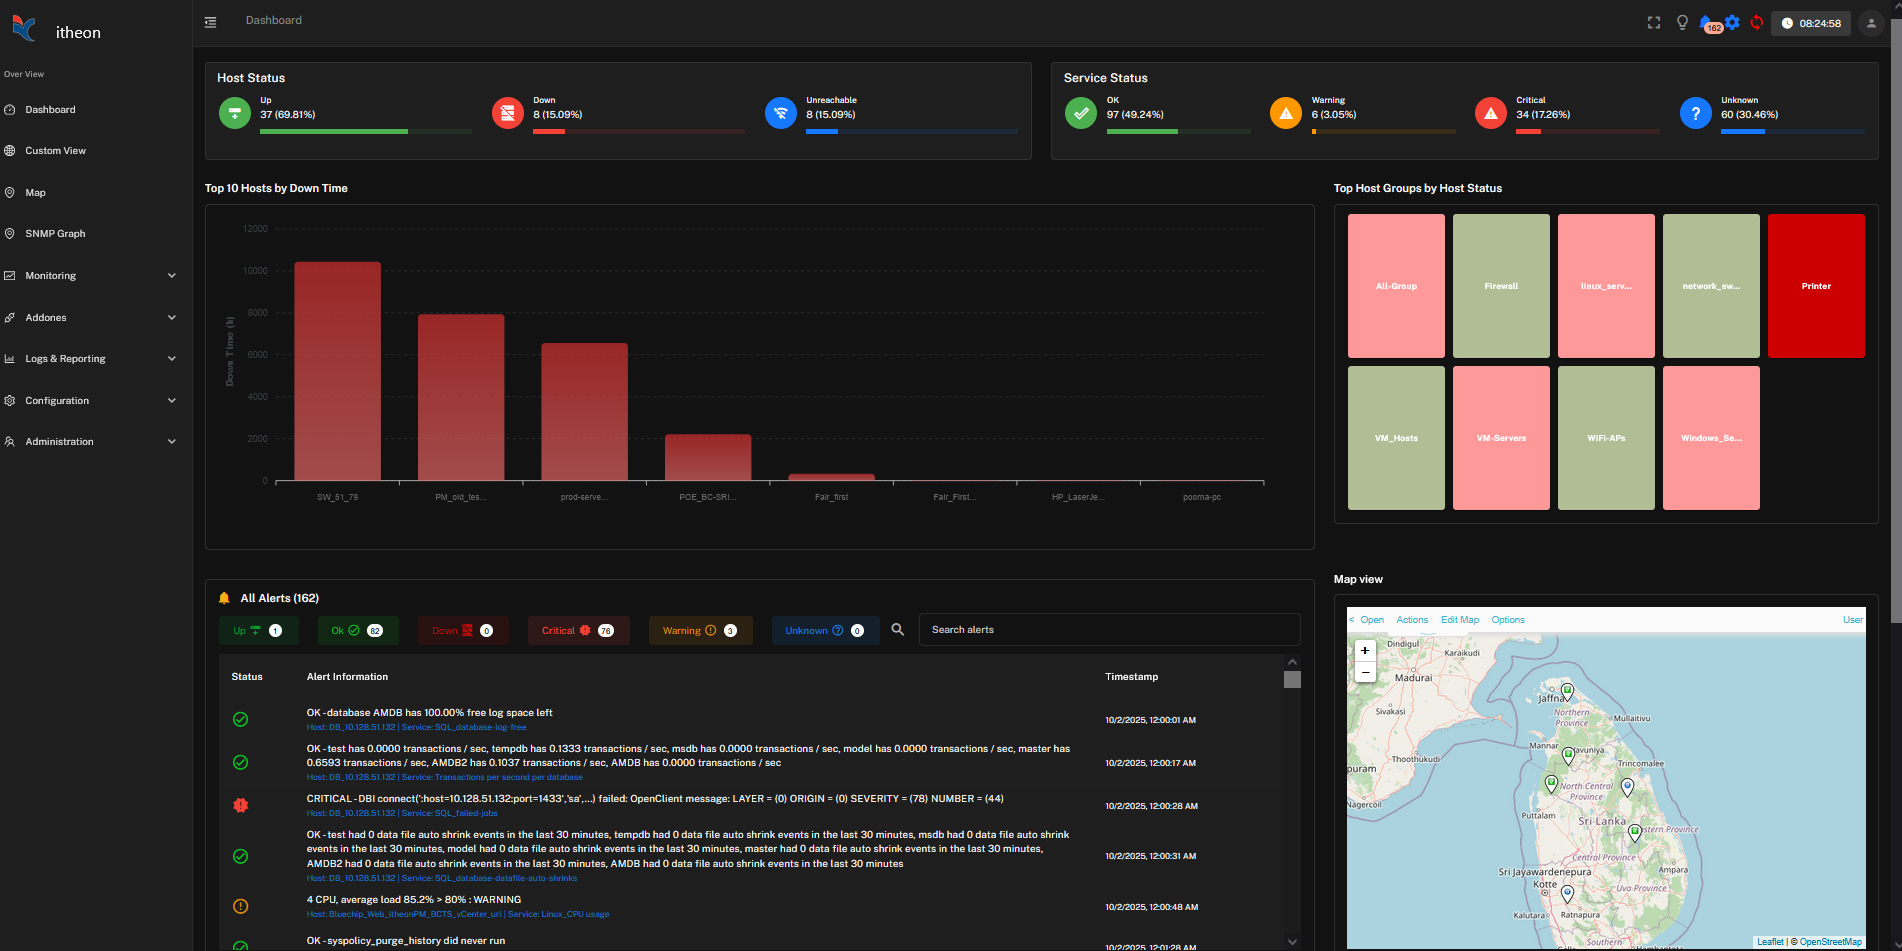
Itheon Performance Monitor dashboard showing host status, service status, and alerts
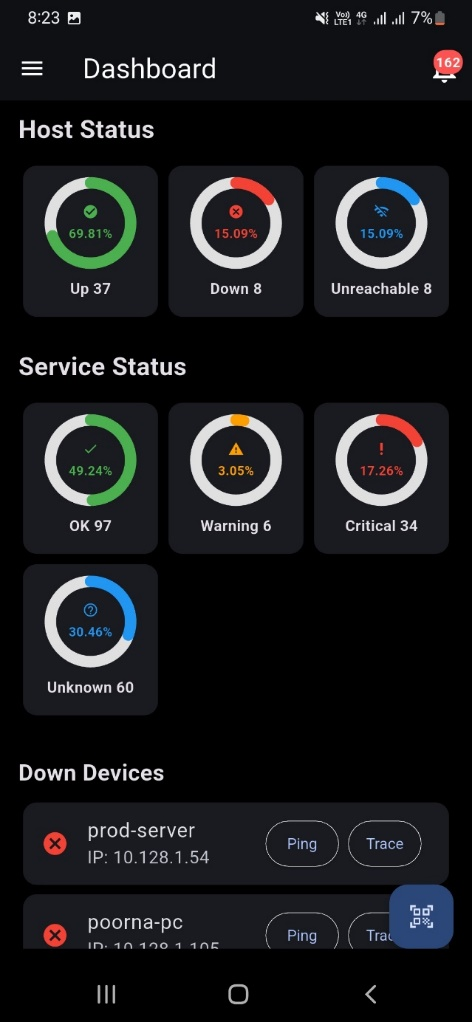
Itheon mobile app dashboard
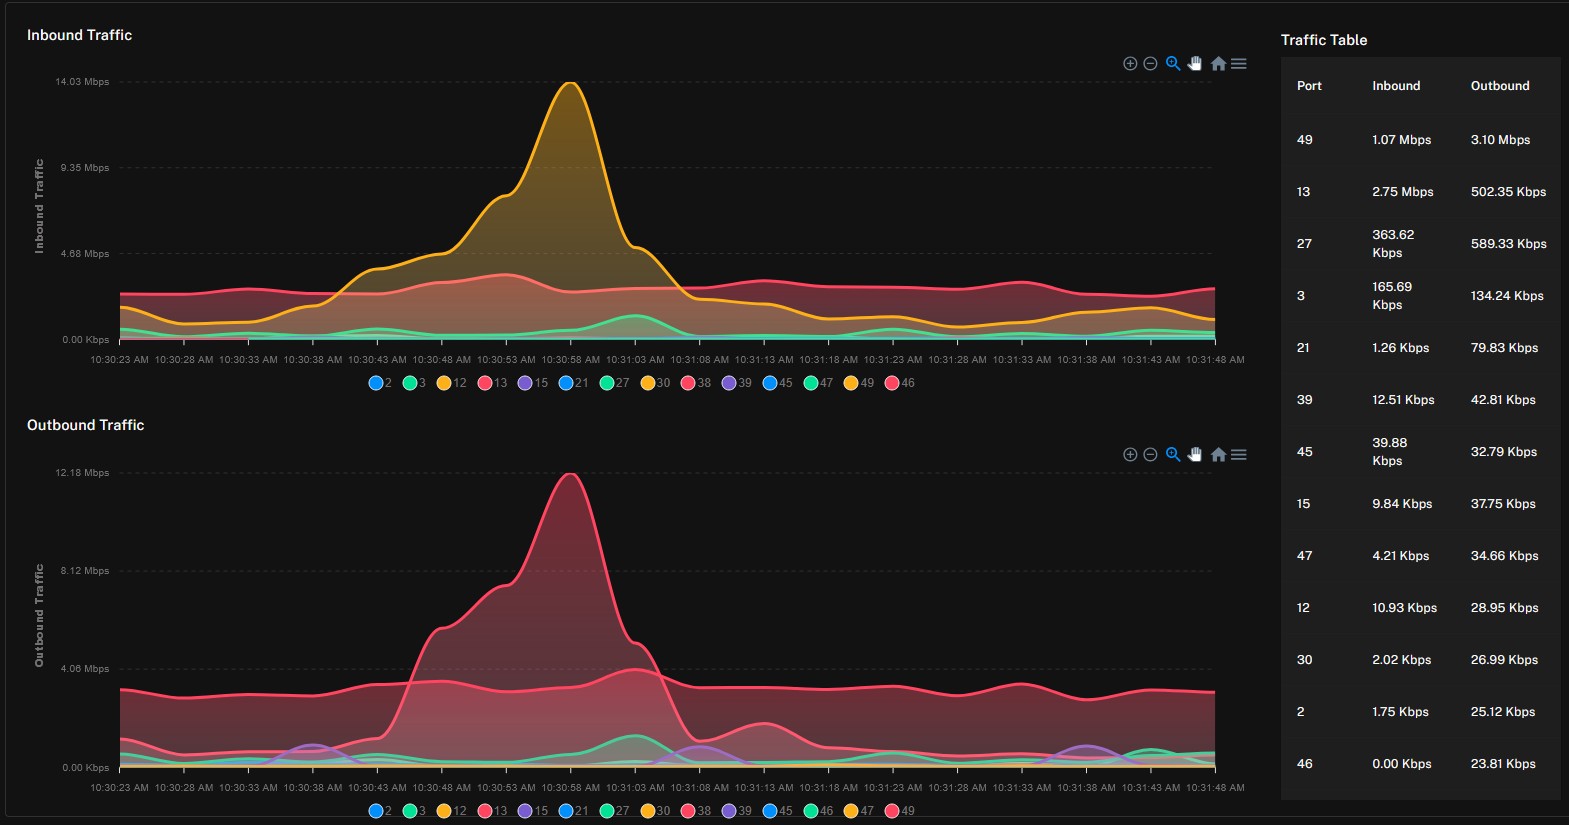
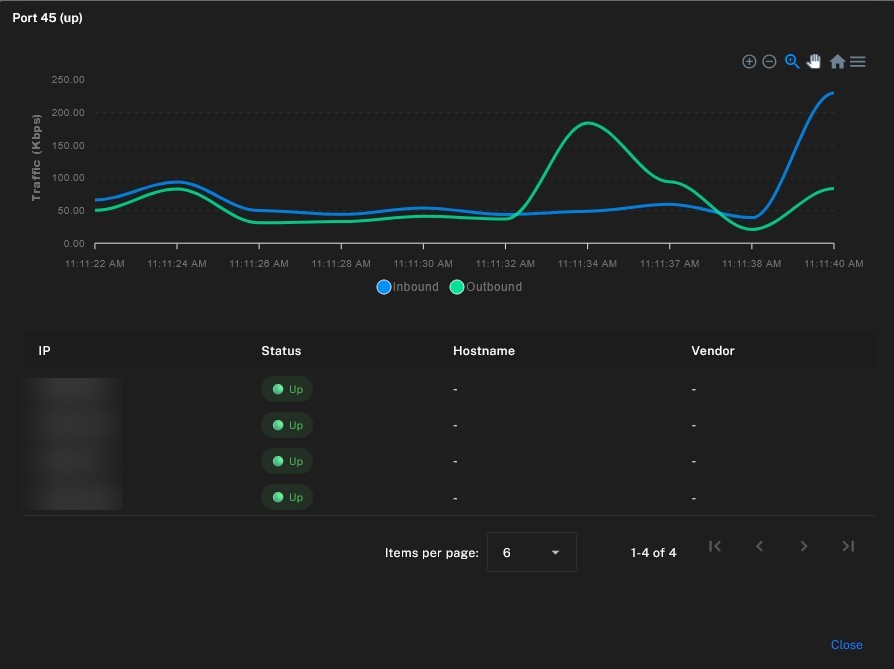
Inbound and outbound network traffic graphs
Capabilities

Monitoring Capabilities

Observe key performance indicators across your entire IT inventory.

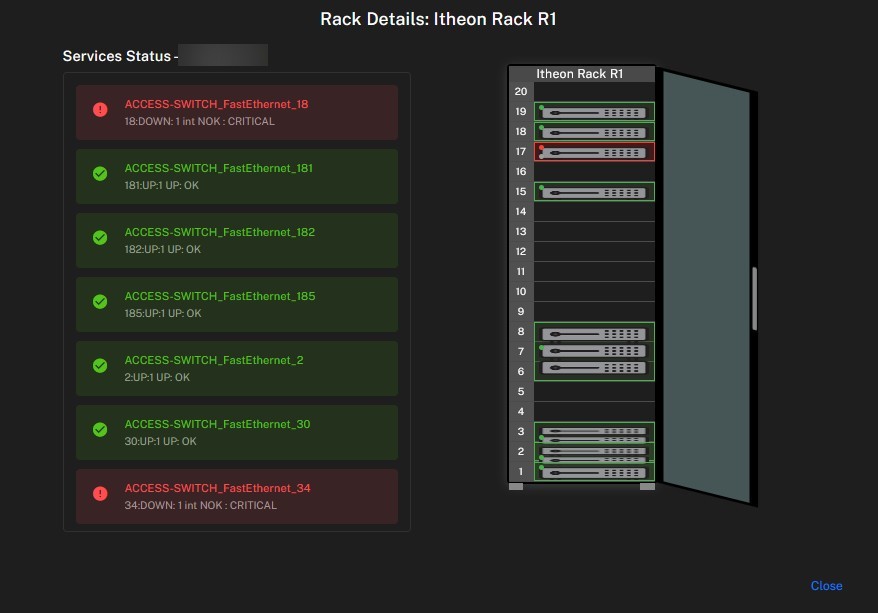
Rack-level server monitoring view

System & Resource Performance

Observe system performance, resource utilization, and deep metrics including CPU, memory, and storage pools.

Inbound and outbound network traffic graphs

Network & Connectivity Telemetry

Identify network performance, connectivity status, bandwidth utilization patterns, and traffic loads in real-time.

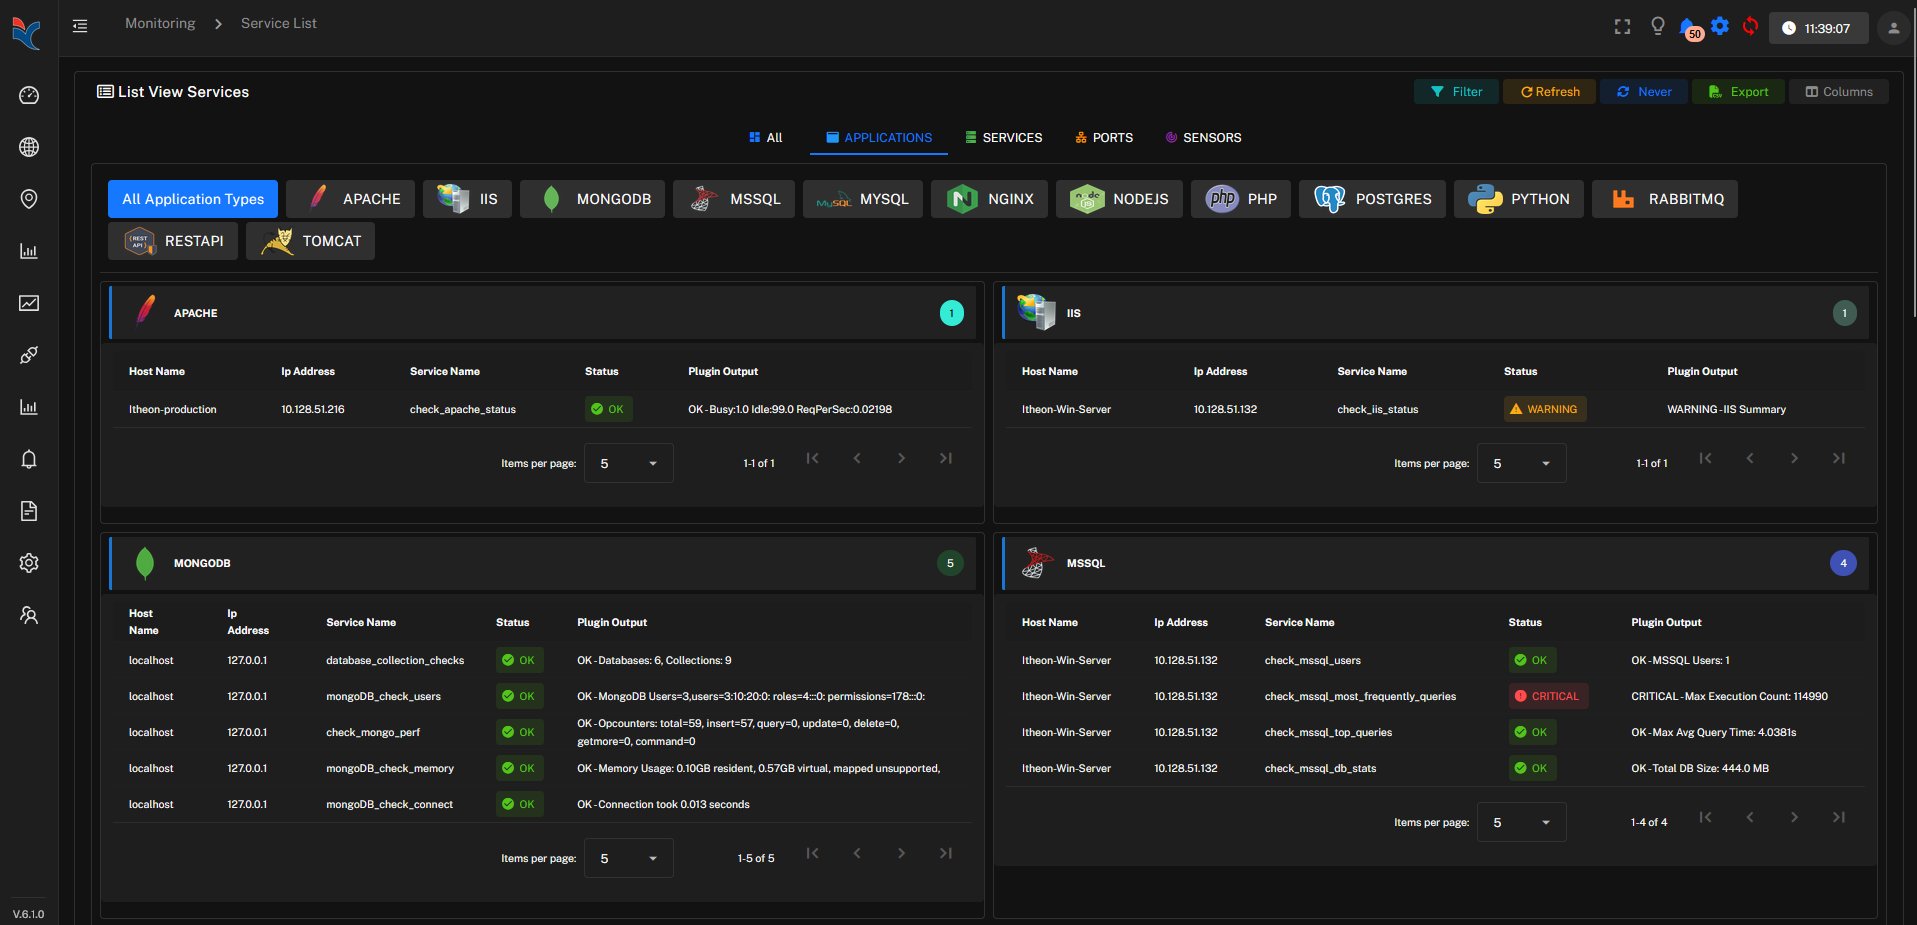
Application and service health monitoring across web servers, databases, and middleware

Application & Service Health

Monitor application responsiveness, service availability, and the operational health of critical business services.

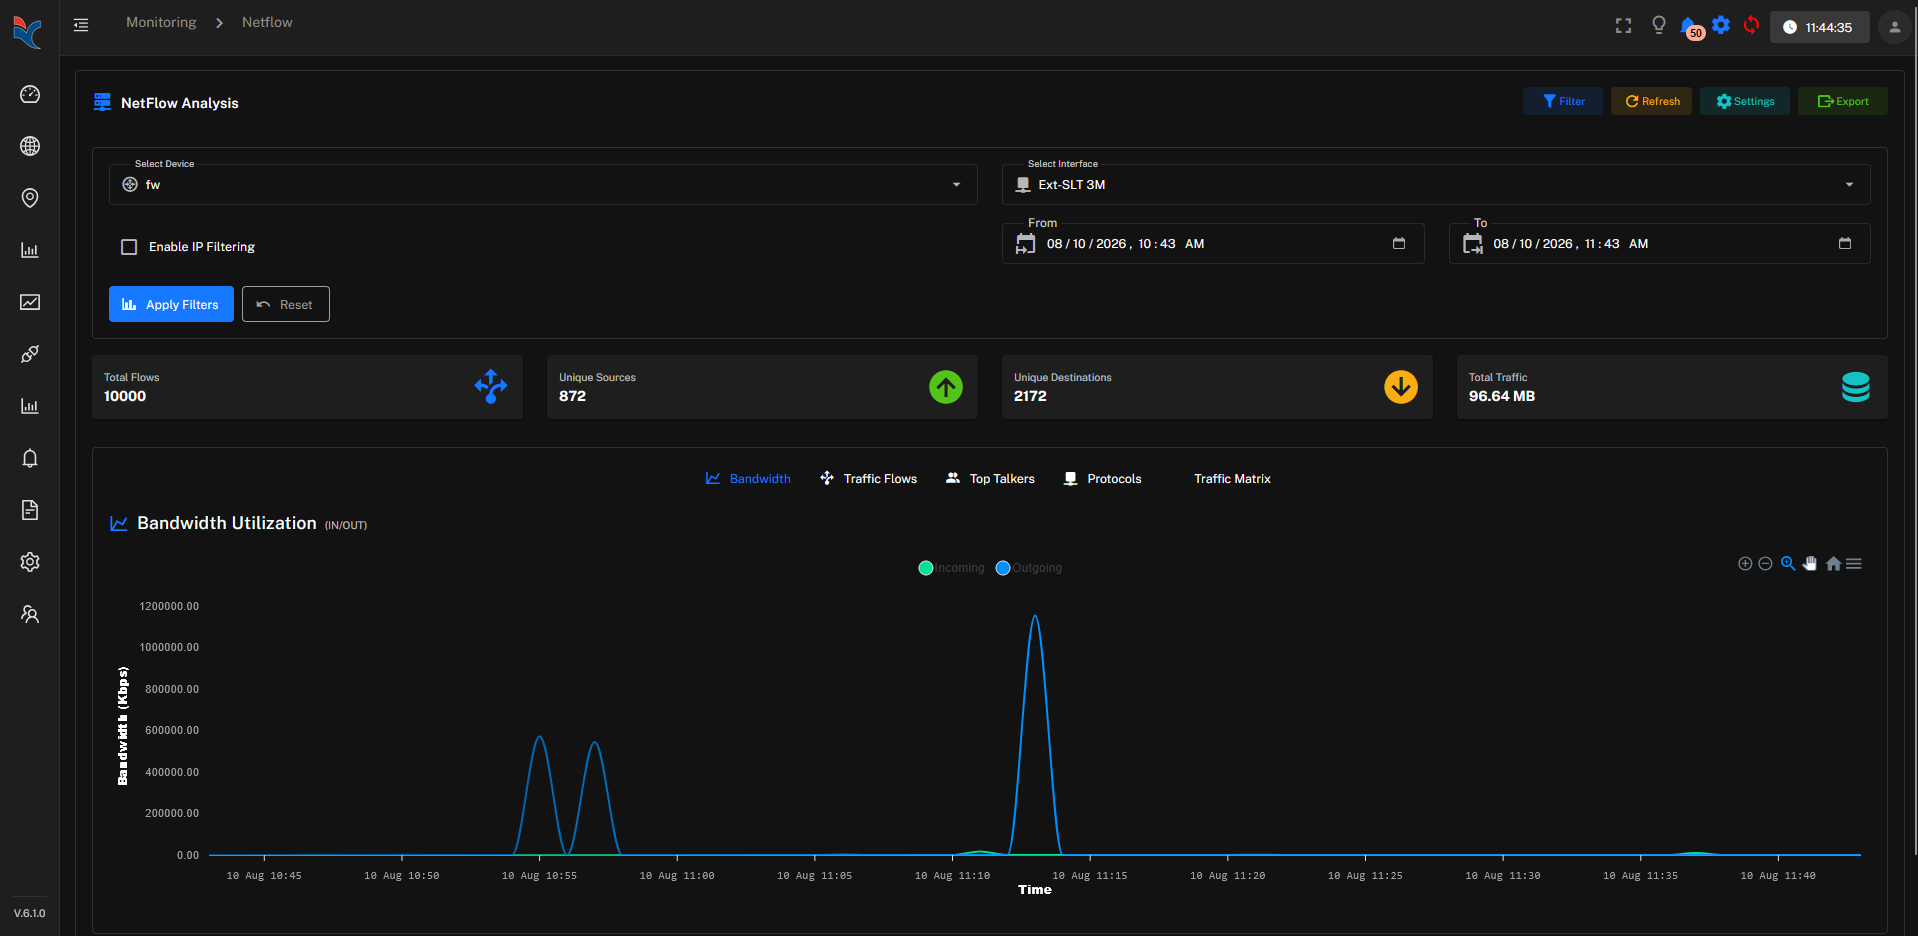
Netflow analysis showing bandwidth utilization and traffic flows

Netflow

Analyze flow-level traffic data to identify top talkers, conversations, and bandwidth consumers across the network.

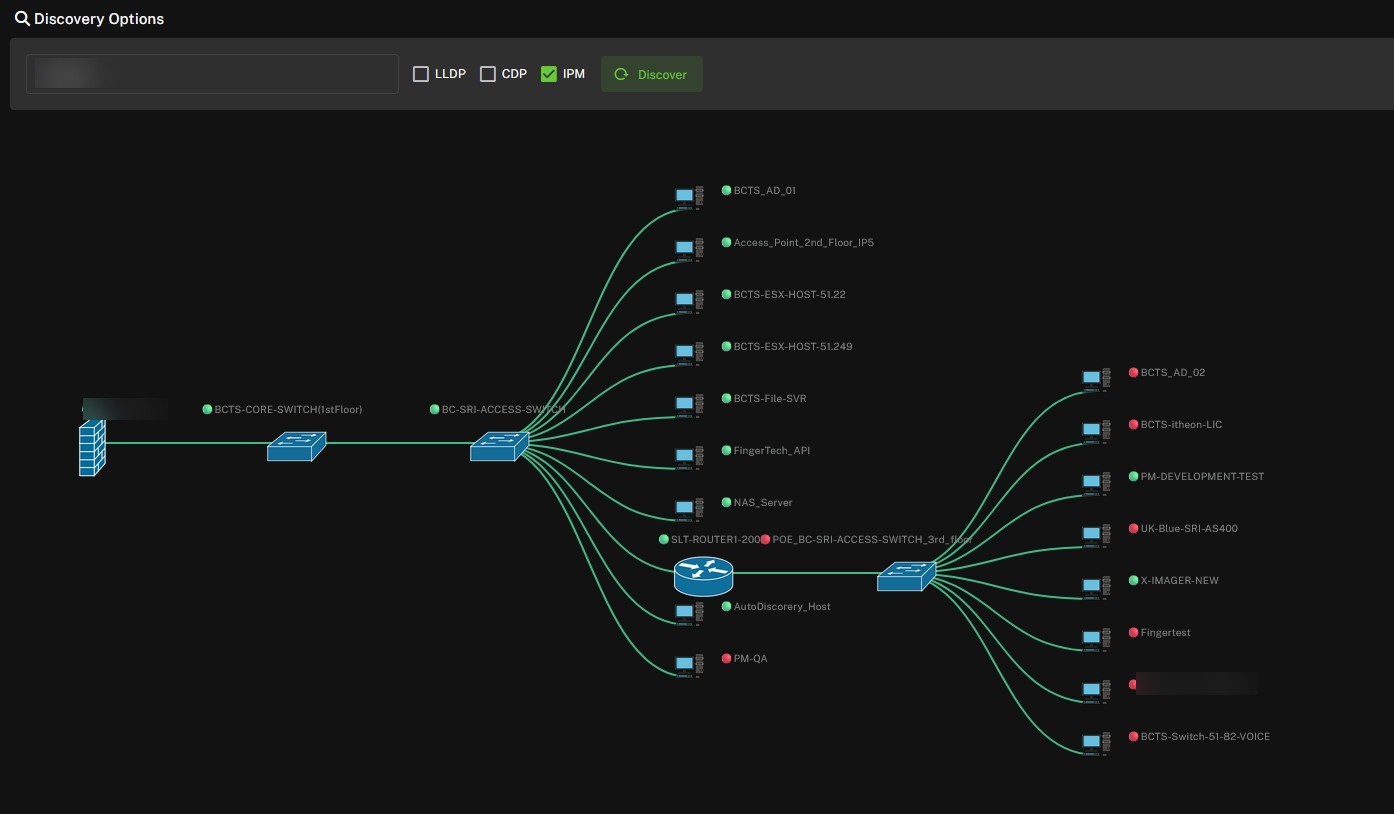
Automated network topology discovery map

Network Topology Monitoring

Automatically discover devices and visualize your network topology with live connectivity mapping.

Performance and capacity monitoring dashboard with resource gauges

Performance & Capacity Monitoring

Track resource consumption and capacity trends to plan ahead and avoid performance bottlenecks.

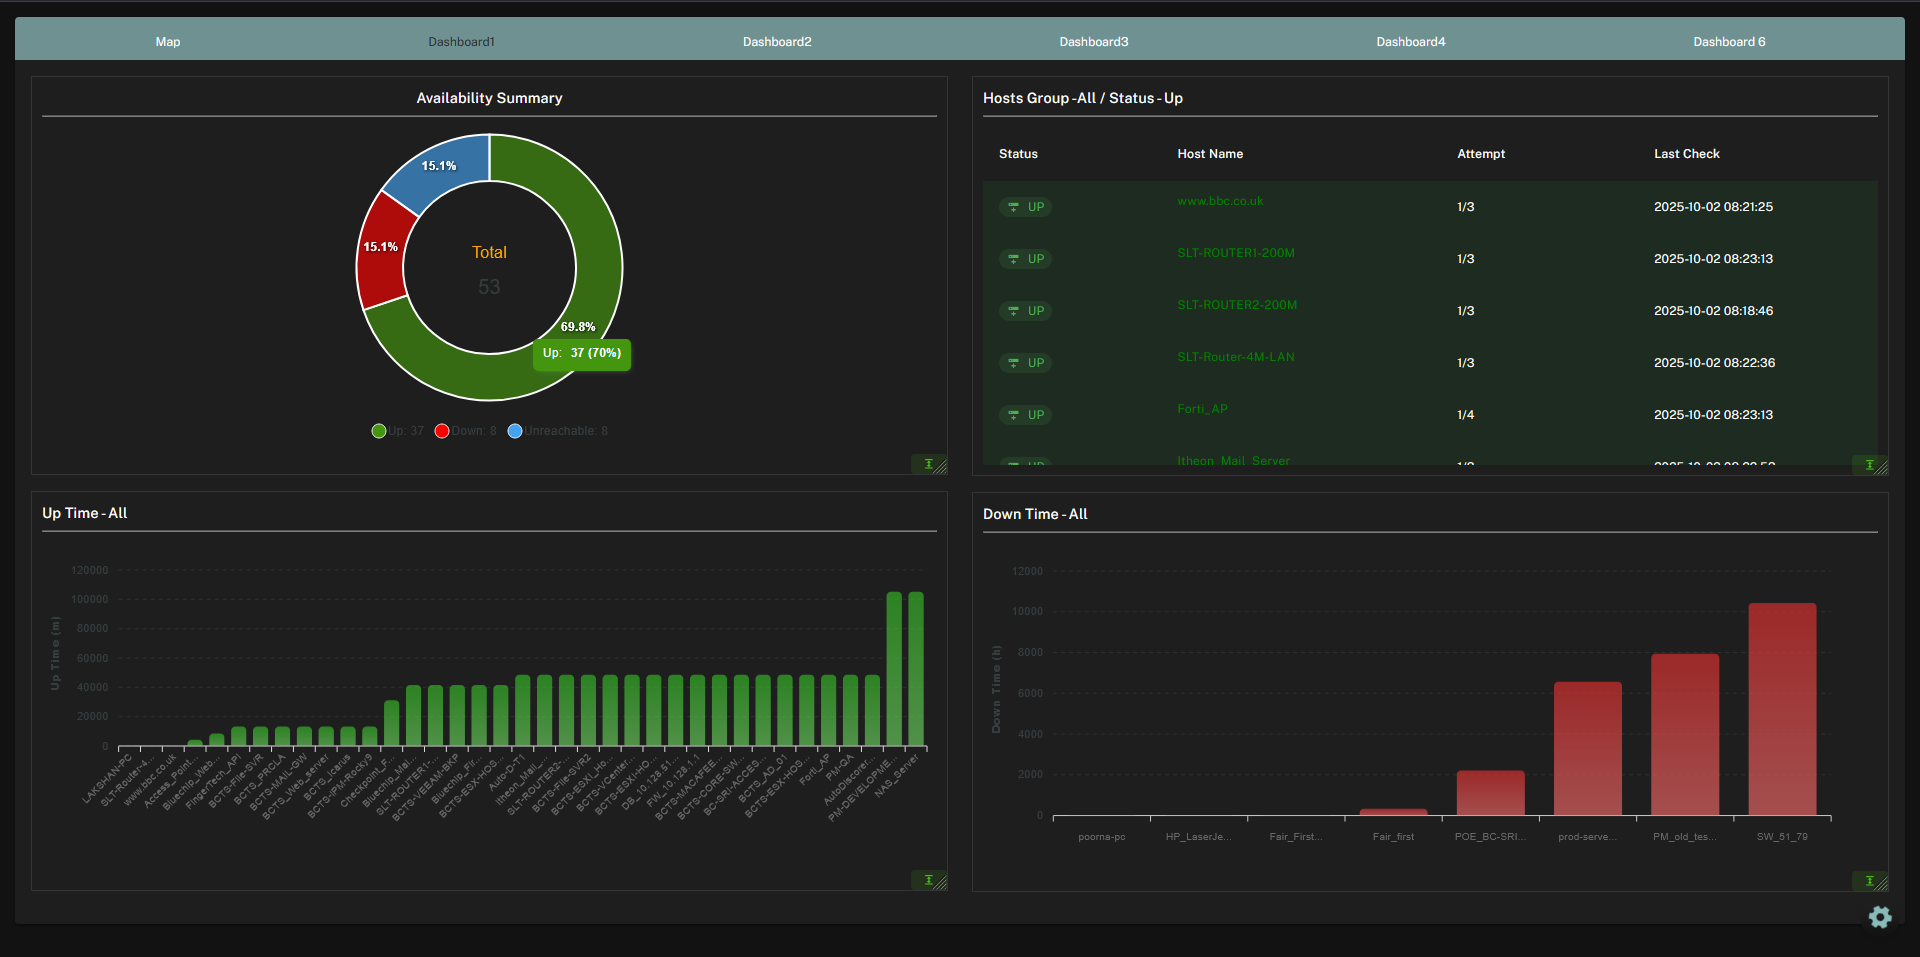
Availability summary with uptime and downtime charts

SLA & Availability Monitoring

Track uptime against SLA targets with continuous availability monitoring across your infrastructure.

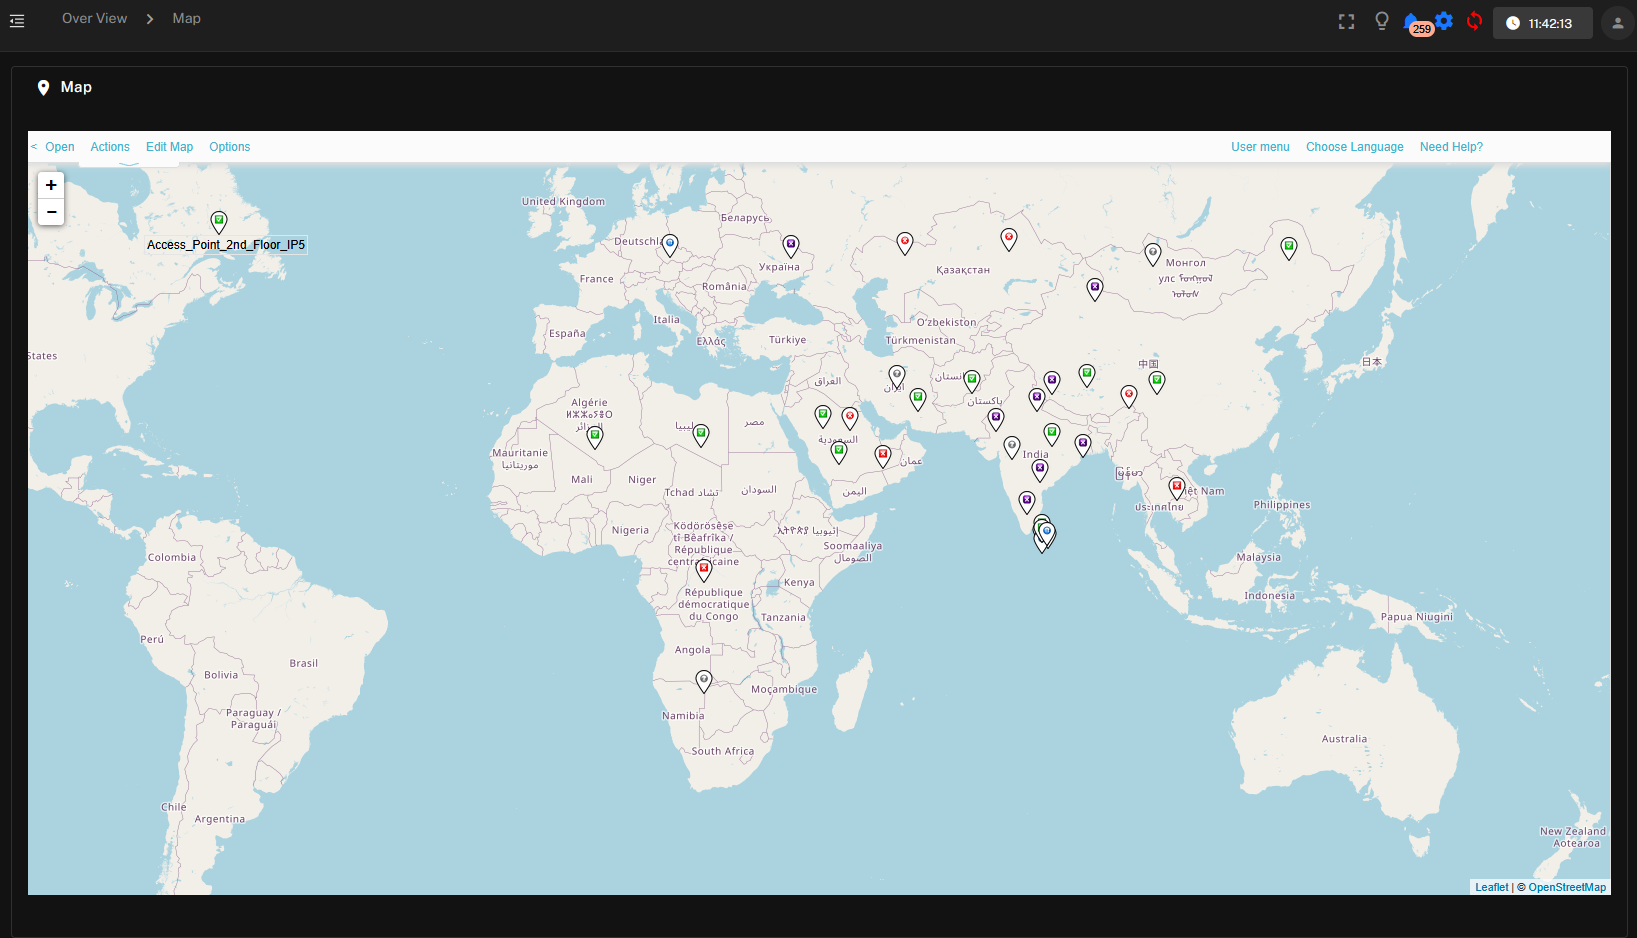
World map showing monitored sites across multiple regions

Multi-Site Monitoring

Monitor distributed infrastructure across multiple sites and regions from one centralized platform.

Alert & Notification System

Intelligent alert management capabilities that help IT teams quickly identify and respond to performance-related incidents.

Reporting & Analytics

Detailed reporting and analytics to support operational monitoring, troubleshooting, and capacity planning.

Mobile App

Itheon Performance Monitor, In Your Pocket

Stay connected to your infrastructure wherever you are. The itheon mobile companion app puts real-time host status, service health, and rack-level visibility on your phone, so nothing goes unnoticed while you're away from your desk.

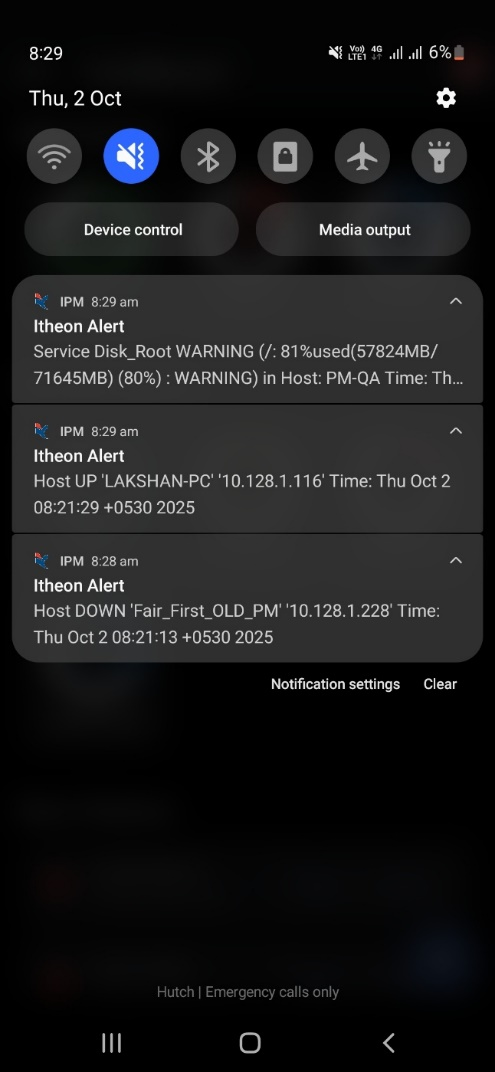
  • Instant push notifications for critical alerts and status changes
  • At-a-glance host and service status dashboards
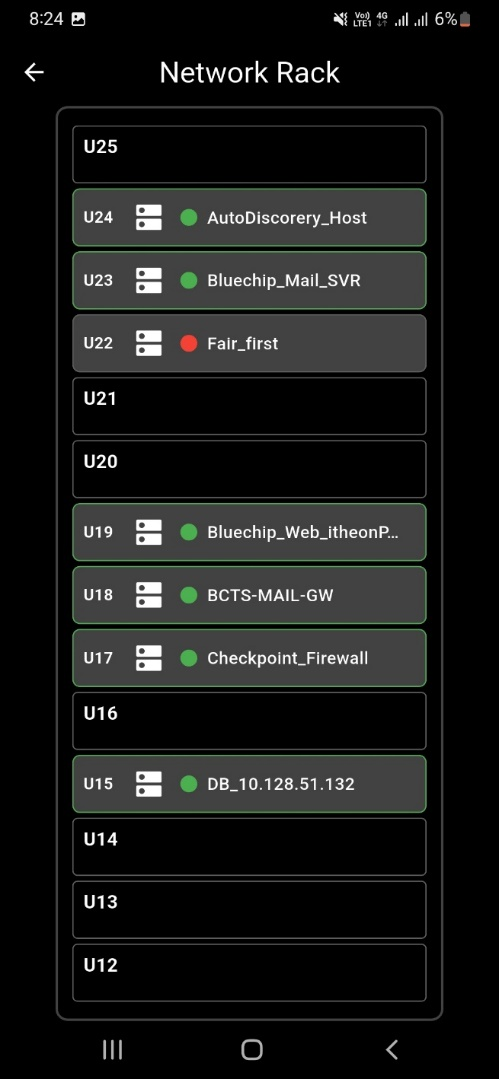
  • Rack-level infrastructure and device visualization
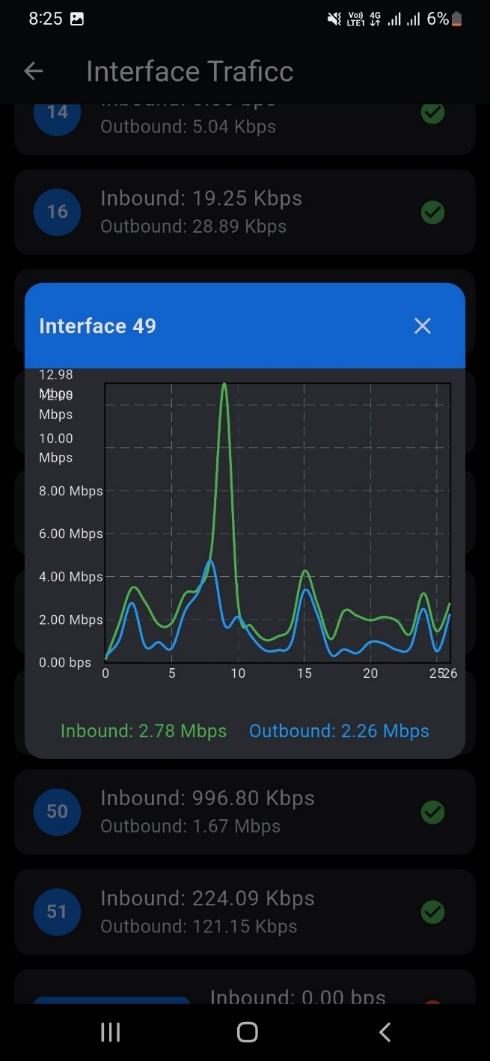
  • Interface-level traffic graphs on the move
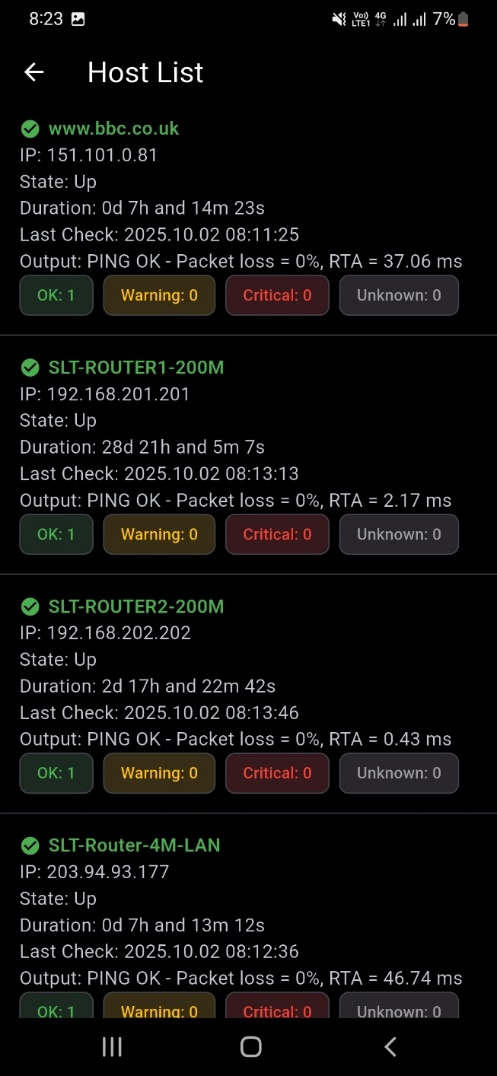
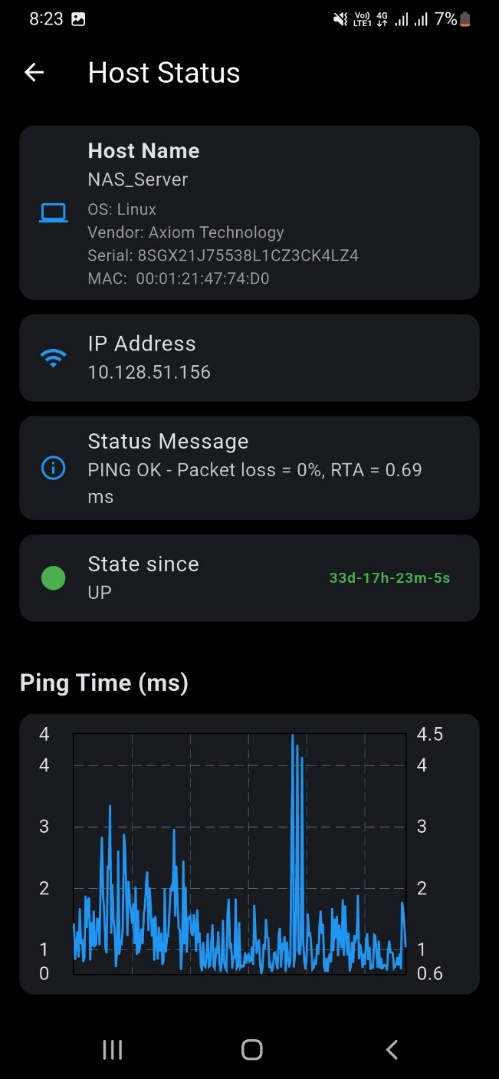
  • Full host list and detailed host status on demand
Request Demo App version v1.1.0
Itheon mobile app push notification alerts
Itheon mobile app dashboard with host and service status
Itheon mobile app network rack view
In The App

More From The App

A few more screens from the itheon mobile companion app.

Itheon mobile app host list Host List
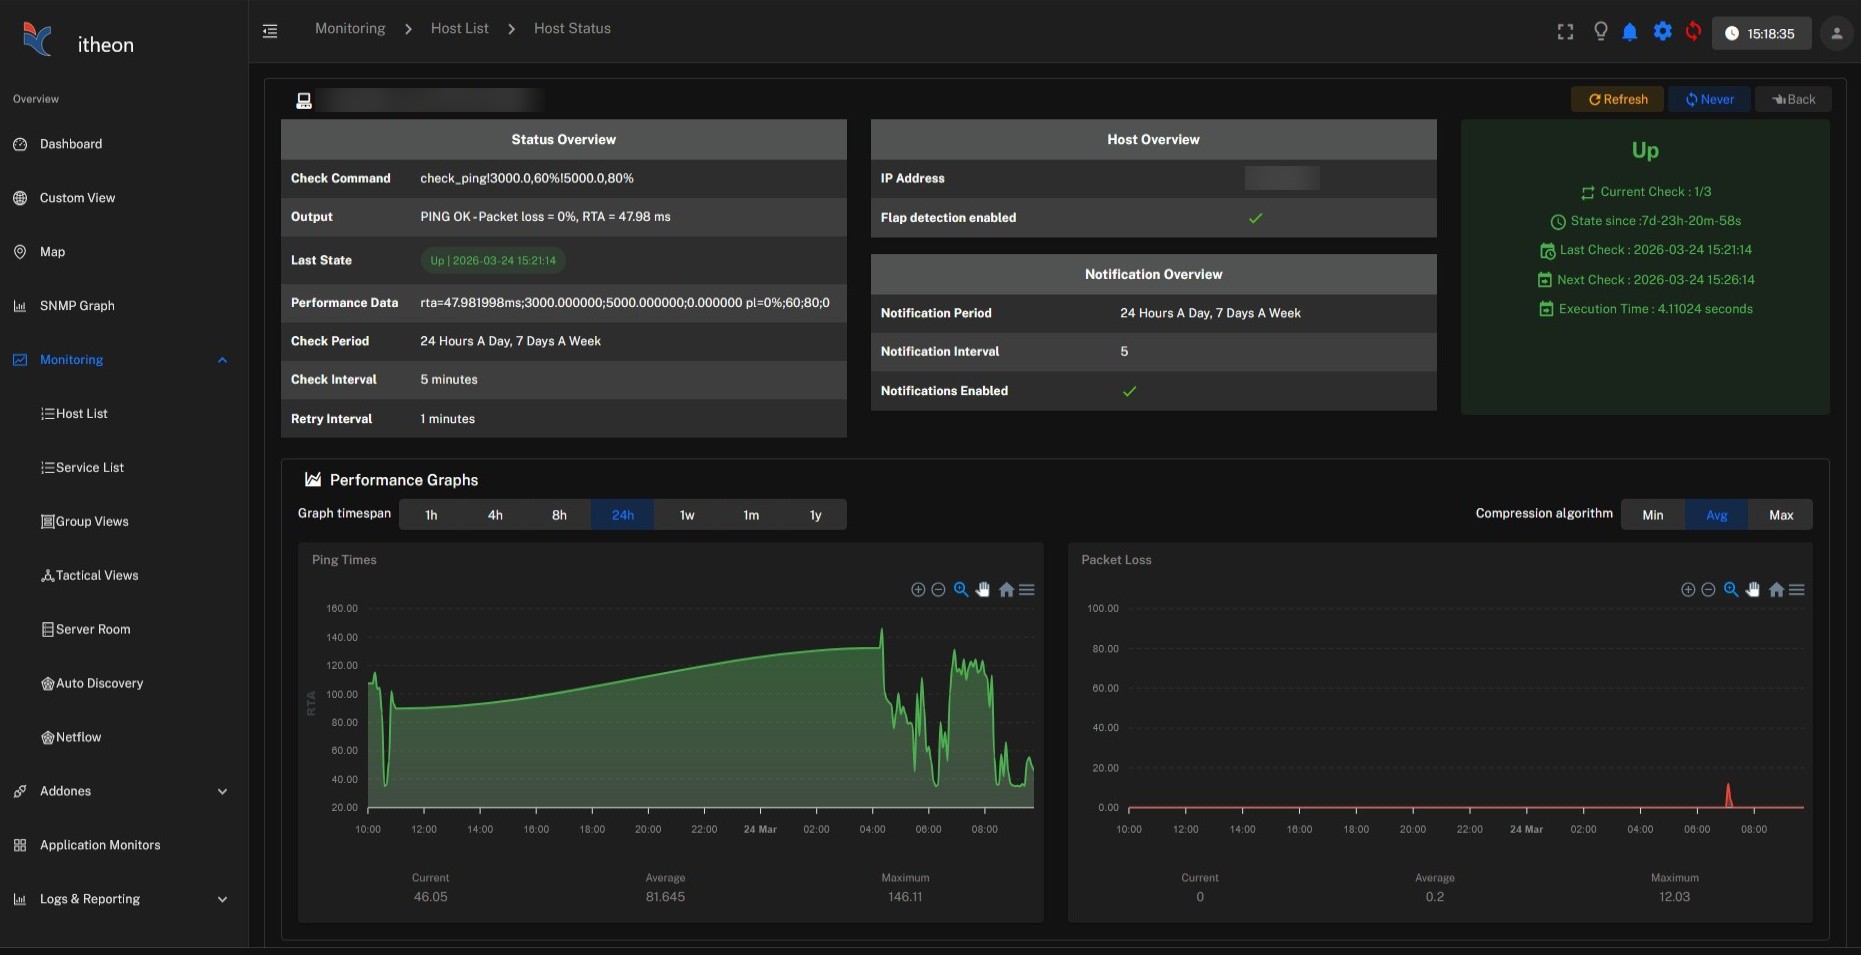
Itheon mobile app host status detail Host Status
Itheon mobile app interface traffic graph Interface Traffic
Value

Benefits

Drive operational excellence and ensure business continuity with proactive performance insights.

IT Performance & Reliability

Improves overall IT performance and reliability across your systems.

Proactive Downtime Prevention

Reduces costly downtime through continuous, proactive performance monitoring.

Faster Detection & Resolution

Enables rapid detection of performance issues before they escalate.

Enterprise-Wide Visibility

Enhances deep visibility across all distributed enterprise environments.

Smart Resource Management

Supports efficient capacity planning and data-driven resource allocation.

Enhanced User Experience

Improves service availability, responsiveness, and end-user satisfaction.

Accelerated Troubleshooting

Accelerates troubleshooting timelines and simplifies incident resolution.

Business Continuity

Supports business continuity plans and maintains operational excellence.

Product Evolution

Version Timeline

From first release to the enterprise platform it is today. Select a version to see what shipped.

v1.0.0 Foundation Release

Core Infrastructure Monitoring

The first release introduced real-time host and service monitoring, giving IT teams a single place to track the health of critical systems.

  • Host & service status monitoring
  • Centralized monitoring dashboard
  • Uptime & availability tracking
  • Ping-based health checks
v2.0.0 Intelligent Alerting

Alerts & Notification System

Threshold-based alert rules and automated notifications were added, helping teams catch performance issues before they escalate.

  • Threshold-based alert rules
  • Automated notifications
  • Escalation management workflows
  • Early warning degradation detection
v3.0.0 Reporting & Analytics

Historical Reporting & Capacity Planning

Version 3.0.0 expanded the platform with historical performance data, trend graphing, and capacity planning reports for long-term infrastructure decisions.

  • Performance trend analysis
  • Capacity planning reports
  • Historical data archives
  • Incident history & event logging
v4.0.0 Netflow Analysis

Netflow Traffic Details

Netflow support gave IT teams flow-level visibility into network traffic, making it possible to see exactly what was moving across the network and where.

  • Netflow-based traffic analysis
  • Flow-level traffic details
  • Top talkers & conversations
  • Deeper network diagnostics
v5.0.0 BI Reporting & Auto Backup

Historical BI Reports, Auto Backup & AD Authentication

Version 5.0.0 added historical business intelligence reporting alongside automated backups, protecting configuration data while giving teams richer long-term insight. Active Directory authentication also arrived, enabling centralized, enterprise-grade login.

  • Historical BI reporting
  • Auto backup feature
  • Long-term trend dashboards
  • Scheduled configuration backups
  • Active Directory (AD) authentication
v6.0.0 Network Visualization & Mobile App

Discovery, Topology Mapping & Mobile App

Automated topology map discovery and rack-level visualization gave teams a complete, visual map of their infrastructure for the first time, alongside the launch of the itheon mobile companion app.

  • Topology map discovery
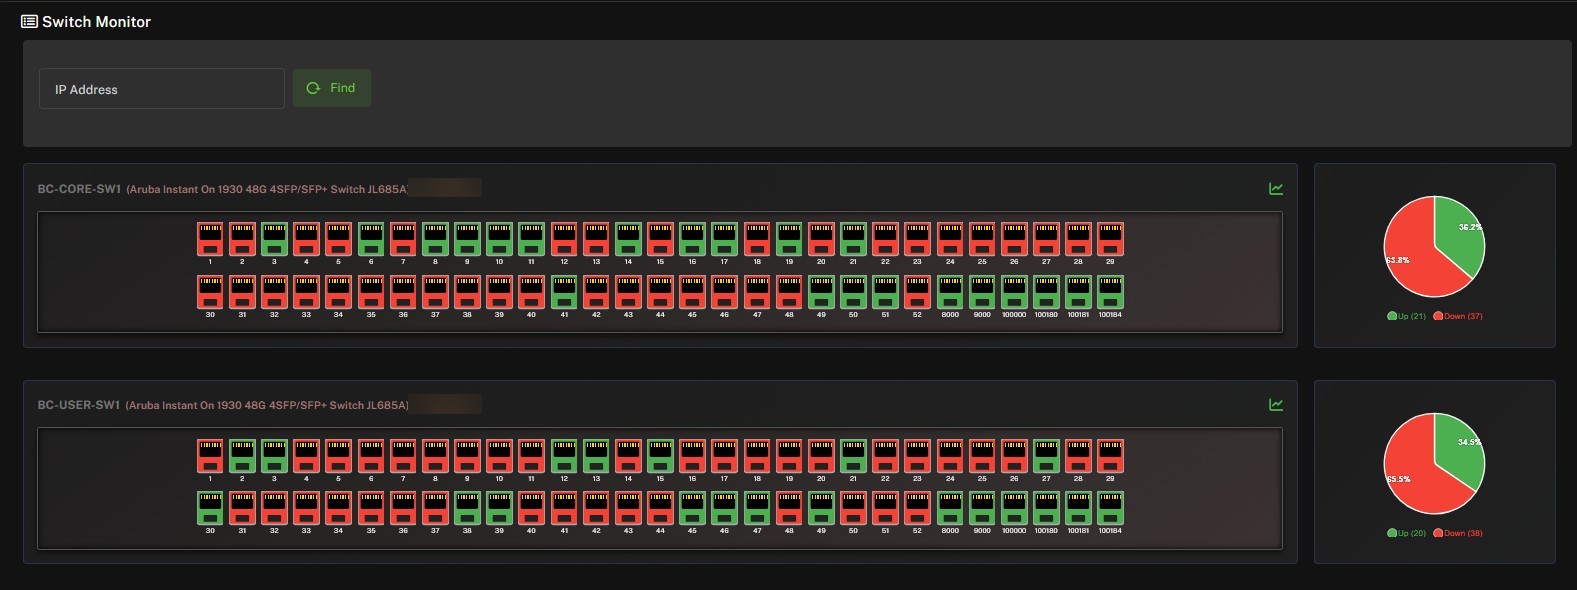
  • Switch port health monitoring
  • Rack-level infrastructure views
  • Mobile application launch
v6.5.0 — Current Advanced Discovery & App Monitoring

LLDP/CDP Discovery & Application Monitoring

The current release adds standards-based LLDP and CDP topology discovery alongside application monitoring, for a more complete and accurate view of your IT estate.

  • LLDP-based topology discovery
  • CDP-based topology discovery
  • Application monitoring
itheon Assistant
Online